I am totally amazed by the scope at which the Tweetorial was documented. One thing that did fascinate me was the “Source of Tweet” graphic. This particular graphic outlines where all the tweets from our Tweetorial are derived from. The majority of the tweets came from the web client which means that most people would need to have been sitting physically at a computer in order to engage in the Tweetorial. So in order for there to be increased activity during the tutorial participants would need to spend more time in front of their computers. For part-time working students this is not always feasible.
Looking at this graphic again also made me curious to why I did not use a mobile application in order to closely engage in the Tweetorial. I have a smart phone, ipad and smartwatch that I carry on my person all the time . All of these devices have twitter installed but I never thought to engage with the tweetorial via these mediums, rather opting to only engage after first logging into the EDC portal and then transferring over to twitter when I got home.

Figure 1: Source of Tweet graphic shows that majority of tweets derived from Twitter web client
The summaries were not always that clearly definable. I found it particular difficult to extrapolate any useful or meaningful information from them. This was a particular topic that came up during our Google Hangouts this week. Many people, including myself, felt as though the summaries did not reflect truely what was happening during the Tweetorial. For example, the tweet archivist only looks at number of tweets per person and perhaps not the quality of the individual tweets. This particular set of data is superficial in a way that perhaps only looks at the amount of time each person spends on twitter.
During the MOOC netnography assignment I came across a very interesting feature of the discussion forums. Users would be rated based on how many upvotes it receives. Forum posts as well as forum threads were ranked by points (see figure 2) This way seems to a more realistic representation of the quality of the posts and not the just based on how many posts a particular person produces within the forum. Perhaps a specific analytic they could have included was the number of posts that received retweets. I feel that such data would be useful and serve to display the significance of a participants contribution to the tutorial.
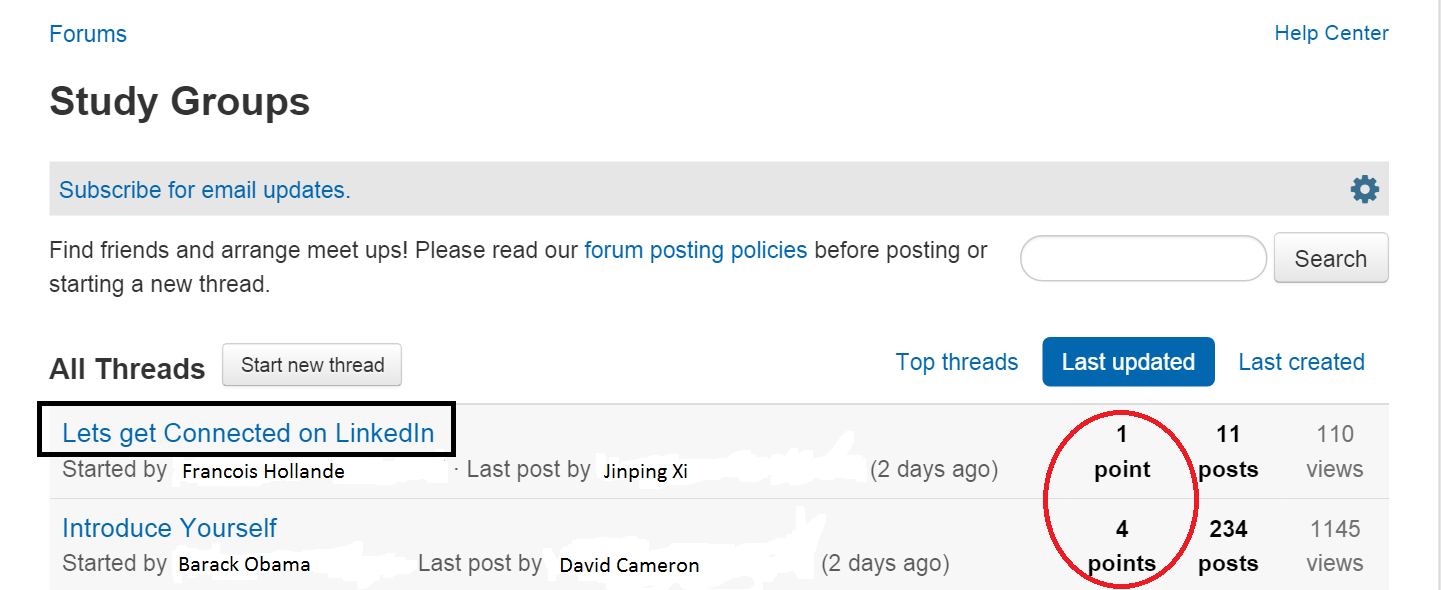
Figure 2: A snapshot of points allocation to threads within forums
As mentioned earlier the summaries in some cases may appear somewhat superficial and less meaningful than what they could be. In terms of using these sorts of analytics in education, summaries on top hashtags, top images and top words could be most useful. These particular summaries and visualisations express certain trends and ideas as they develop within the tutorial. Top words and top hashtags are extremely useful because it helps to illustrate a theme that developed throughout the tweetorial. This will allow tutors to pin point major topics or issues that were common amongst the participants and address these further.