
- Data ownership and sharing between systems, organisations, and stakeholders
- Location and interpretation of data
- Informed consent, privacy, and de-identification of data
- Classification and management of data
- What will be done with the data – how can the potential value of the data be leveraged without succumbing to the dangers associated with tracking students’ learning options based on deterministic modeling? Obligation to act?
- Understanding accuracy and limitations of the data – misinterpretation could lead to inappropriate response from teachers
Category Archives: Lifestream
Are statisticians and data scientists now doing the job of sociologists? #mscedc
from http://ift.tt/1AKfBYz
via IFTTT
#mscedc http://t.co/LtJarnwefN
from http://ift.tt/1AKfBYz
via IFTTT
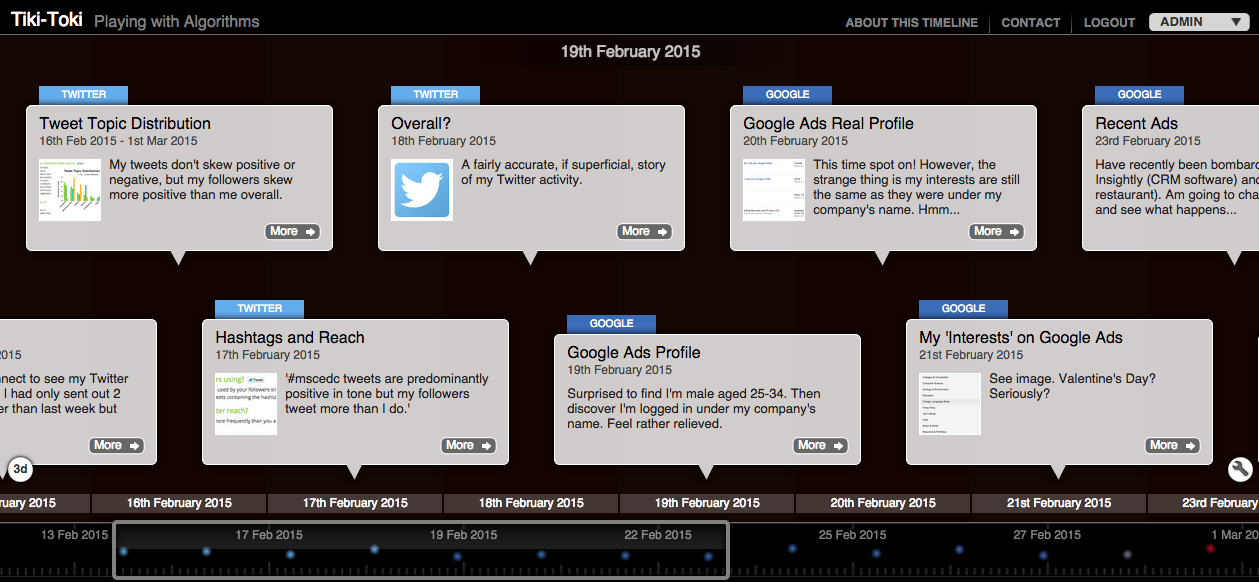
Here’s the link to the timeline for my algorithm play http://t.co/NjwlKmOgF2 Will blog in more detail in the weekly summary #mscedc
from http://ift.tt/1AKfBYz
via IFTTT
@sbayne Here’s mine http://t.co/Iu8bQWZHs9 ‘my followers skew more positive than me’ #mscedc
from http://ift.tt/1AKfBYz
via IFTTT
Fenwick et al. contend that ‘[c]yberspaces are not therefore merely a new educational tool, but can spatially reconfigure the forms of knowing, sociality and subjectivity enacted through educational (en)counters’ (2011, p157). Distributed or aggregated educational spaces are not simply better or worse for learning. They qualitatively change the space in ways shaped by digital systems, through procedures that are irreducible to human intention or agency. The implications for education are that many social media and web services, as well as MOOC platforms such as Coursera, are being controlled, not by educators, but by large multinational for-profit companies. (Knox, J., 2014)
In case you were wondering, this is what an algorithm looks like :) #mscedc http://t.co/1ZsMbKr52X

from http://ift.tt/1AKfBYz
via IFTTT
#mscedc http://t.co/yMtvr7H09a
Great TED talk on how algorithms shape our world. #mscedc
via IFTTT
Infographics
Have been exploring different ways of presenting information this week and tried making an infographic just for fun. The information comes from the article I posted earlier in the week on FutureLearn.
I used the free version of piktochart.com and it was fairly easy and intuitive drag and drop process.

Information taken from BBC article ‘UK online course provider FutureLearn reaches million’ by Sean Coughlan, 19th February 2015